Anodizing Color Variation by Alloy: Why Your Aluminum Parts Don’t Match , and How to Fix It
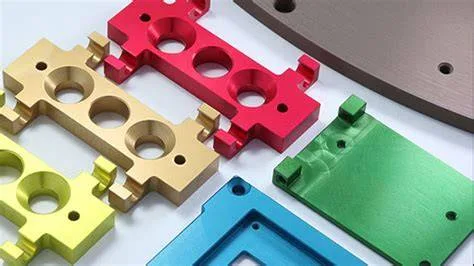
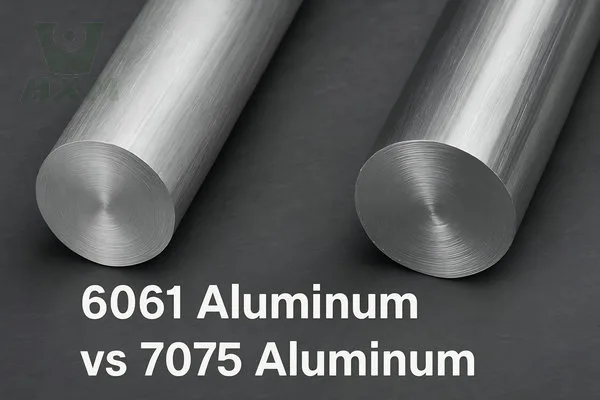
You ordered 200 CNC-machined aluminum parts. Half are 6061-T6, half are 7075-T6, both called out as “black anodized.” When they come back, the 6061 pieces are a deep, uniform black. The 7075 pieces carry a bronze-gray undertone that no amount of back-and-forth with your anodizer will fix. That’s not a processing error. It’s metallurgy. Anodizing color variation between aluminum alloys is one of the most misunderstood issues in precision manufacturing. Engineers specify a color on a drawing, expect uniform results, and then deal with rejection rates, customer complaints, or assembly-level cosmetic failures when different alloys respond differently to the same anodizing bath. This guide explains why aluminum alloys produce different anodizing colors, which alloying elements cause the biggest shifts, and what procurement teams and design engineers can actually do about it. Everything here comes from the production floor at JLYPT, where we run thousands of anodized CNC parts a month for aerospace, medical, and automotive clients.
How Anodizing Creates Color, and Why Alloy Composition Matters
Anodizing is an electrochemical conversion process. Unlike paint or plating, the anodic oxide layer grows from the base aluminum itself. The aluminum surface is converted into aluminum oxide (Al₂O₃) through controlled oxidation in an acid electrolyte, typically sulfuric acid for Type II anodizing per MIL-A-8625. That oxide layer is porous. The pores absorb organic or inorganic dyes before being sealed with boiling water or nickel acetate. The final color comes down to three things:
- Pore structure: diameter, depth, spacing, and regularity of the oxide pores
- Oxide transparency: how much light passes through the oxide versus how much is absorbed or scattered
- Substrate reflectivity: the optical properties of the base metal under the oxide
Here’s the part that catches people off guard: all three are driven by the alloy composition underneath. Two alloys placed in the same sulfuric acid bath, at the same voltage, temperature, and time, will grow oxide layers with different pore geometries, different optical densities, and different base-metal reflectivities. The result is visible color variation, even when the dye chemistry is identical.
The Oxide Layer Isn’t a Coating. It’s the Alloy, Transformed
Engineers used to specifying paint or powder coat sometimes treat anodizing as an opaque coating applied over a substrate. That mental model gets you into trouble. Anodic oxide is translucent to semi-transparent. The underlying alloy stays optically active. Any alloying element that disrupts the orderly growth of Al₂O₃ will change how the oxide behaves optically. Think of it this way: painting a red wall white takes enough paint to hide the red. Anodizing is more like laying a tinted glass window over a colored floor. The floor color, which is the alloy composition, always shows through.
Alloying Elements That Drive Color Variation
Aluminum alloys contain controlled additions of copper, silicon, magnesium, zinc, manganese, and other elements. Each one interacts differently with the anodizing process.
Copper (Cu): The Biggest Color Disruptor
Copper is the primary alloying element in 2xxx-series alloys (2024, 2011, 2014) and a significant secondary element in 7xxx-series alloys (7075 contains 1.2–2.0% Cu). Effect on anodizing:
- Copper dissolves into the sulfuric acid electrolyte during anodizing, leaving a less uniform oxide structure
- CuAl₂ intermetallic particles (θ-phase) don’t oxidize at the same rate as the surrounding aluminum matrix
- Those particles create localized disruptions: micro-voids, inclusions, and optical scattering centers inside the oxide film
- The oxide layer ends up darker, more yellow-brown, and less transparent
Practical impact
A 2024-T3 part anodized in the same bath as a 6061-T6 part will look distinctly darker and warmer. Black dye over 2024 oxide gives you a brownish-black rather than a blue-black. Clear anodizing on 2024 comes out yellow-gold instead of the silver-gray you get on 6061.
Silicon (Si): Gray Shift and Reduced Clarity
Silicon shows up in cast alloys (A356, A380) and in 6xxx-series wrought alloys (6061 contains 0.4–0.8% Si; 4xxx brazing alloys run 4.5–13% Si). Effect on anodizing:
- Silicon particles are inert during anodizing; they don’t convert to oxide
- They stay embedded in the growing oxide film as dark inclusions
- High silicon content (above 1%) produces a gray, cloudy, or matte oxide
- Dye absorption gets uneven because the pore structure is disrupted around the silicon particles
Practical impact
Cast aluminum parts (often 7–12% Si) come out dark gray regardless of what dye you use. Getting bright, saturated colors on high-silicon alloys with conventional Type II anodizing is essentially a non-starter.
Magnesium (Mg): Generally Favorable
Magnesium is the primary alloying addition in 5xxx-series alloys (5052, 5083) and a secondary element in 6xxx alloys. Effect on anodizing:
- Mg₂Si precipitates in 6xxx alloys can create minor optical inconsistencies, but the effect is small compared to copper or silicon
- Pure Mg additions (as in 5xxx alloys) generally support clear, uniform oxide growth
- 5052 and 5005 get recommended for decorative anodizing applications because of their clean oxide response
Zinc (Zn): Moderate Darkening
Zinc is the primary alloying element in 7xxx-series alloys (7075 contains 5.1–6.1% Zn). Effect on anodizing:
- Zinc causes moderate oxide darkening, which is a big part of the gray-bronze tone you see on anodized 7075
- MgZn₂ (η-phase) precipitates create localized anodizing irregularities
- Combined with the copper in 7075, zinc pushes the color further away from neutral tones
Manganese (Mn): Brown Undertone
Manganese is the primary element in 3xxx-series alloys (3003, 3105). Effect on anodizing:
- Mn produces a slight brown or yellow undertone in the oxide film
- The effect is mild at typical 3003 concentrations (1.0–1.5% Mn) but shows up when you put parts side by side with 6061 or 5052
Alloy-by-Alloy Anodizing Color Reference Table
The table below summarizes the typical anodizing color response for the most commonly CNC-machined aluminum alloys. This data reflects Type II sulfuric acid anodizing (per MIL-A-8625, Type II, Class 2) with standard organic dye processes.
| Alloy | Series | Key Alloying Elements | Clear Anodize Appearance | Black Dye Result | Color Dye Suitability | Relative Color Consistency |
|---|---|---|---|---|---|---|
| 1100 | 1xxx | 99%+ Al | Bright silver, high clarity | Deep uniform black | Excellent , vivid, saturated colors | ★★★★★ |
| 3003 | 3xxx | 1.2% Mn | Slight yellow-silver | Black with faint brown undertone | Good , slight warmth in light colors | ★★★★☆ |
| 5052 | 5xxx | 2.5% Mg, 0.25% Cr | Clear silver-gray | Clean black | Very good , popular for decorative work | ★★★★★ |
| 5083 | 5xxx | 4.4% Mg, 0.7% Mn | Slightly matte silver | Clean black, slightly matte | Good | ★★★★☆ |
| 6061 | 6xxx | 1.0% Mg, 0.6% Si, 0.28% Cu | Clear silver with faint yellow | Blue-black, uniform | Good , industry standard for anodizing | ★★★★☆ |
| 6063 | 6xxx | 0.7% Mg, 0.4% Si | Bright clear silver | Deep uniform black | Excellent , preferred for architectural anodizing | ★★★★★ |
| 2024 | 2xxx | 4.4% Cu, 1.5% Mg | Yellow-gold, cloudy | Dark brown-black, uneven | Poor , colors shift warm and muddy | ★★☆☆☆ |
| 7075 | 7xxx | 5.6% Zn, 2.5% Mg, 1.6% Cu | Gray-brown, semi-opaque | Bronze-black, not true black | Fair , limited to dark colors | ★★★☆☆ |
| A356 (Cast) | , | 7% Si, 0.35% Mg | Dark gray, matte | Near-black gray, matte | Poor , silicon dominates appearance | ★★☆☆☆ |
The short version
If your assembly needs color-matched anodized parts, picking alloys from the same family, or better, the same alloy, takes the biggest source of variation off the table.
Putting a Number on the Difference: Delta E (ΔE)
Color variation isn’t just subjective. The CIE L*a*b* color space gives you a numerical framework for measuring color differences. The metric ΔE (Delta E) quantifies the perceptible difference between two color samples:
- ΔE below 1.0: Not perceptible to the human eye
- ΔE 1.0–2.0: Perceptible on close inspection
- ΔE 2.0–3.5: Perceptible at a glance; may be fine for non-cosmetic parts
- ΔE 3.5–5.0: Obvious color difference; typically rejected for cosmetic assemblies
- ΔE above 5.0: Unmistakable mismatch; reads as a different color
Measured ΔE Values Between Common Alloy Pairs (Black Type II Anodize)
Alloy Pair Typical ΔE Range Visual Assessment 6061 vs. 6063 0.8–1.5 Nearly identical; acceptable for most assemblies 6061 vs. 5052 1.2–2.5 Slight difference; usually acceptable 6061 vs. 7075 3.5–6.0 Obvious mismatch; bronze vs. blue-black undertone 6061 vs. 2024 5.0–8.0 Severe mismatch; brown-black vs. blue-black 6063 vs. 7075 4.0–7.0 Significant mismatch 5052 vs. 3003 1.5–3.0 Minor difference; warm undertone on 3003 6061 vs. A356 Cast 6.0–10.0+ Completely different appearance
These values were measured under D65 illuminant at 10° observer angle using a spectrophotometer, consistent with ASTM D2244 color difference measurement protocols. For procurement teams:
If your spec requires ΔE below 2.0 across an assembly, all mating parts need to be the same alloy and temper. Mixing alloy series, particularly combining 2xxx or 7xxx with 6xxx, will blow past that threshold no matter how well you tune the anodizing process.
Type II vs. Type III Anodizing: How Process Type Affects Color Variation
The anodizing process type has a big say in how alloy composition shows up as color variation.
Type II Sulfuric Acid Anodizing (MIL-A-8625, Type II)
- Oxide thickness: 0.0002″–0.001″ (5–25 µm)
- Bath temperature: 68–72°F (20–22°C)
- Pore structure: Regular, columnar pores with good dye absorption
- Color behavior: Alloy-driven color variation is moderate. Dye penetration is relatively uniform across most 5xxx and 6xxx alloys. High-copper alloys (2xxx, 7xxx) show the most deviation.
Type III Hard Anodizing (MIL-A-8625, Type III)
- Oxide thickness: 0.001″–0.004″ (25–100 µm)
- Bath temperature: 28–36°F (−2 to 2°C)
- Pore structure: Denser, less porous oxide with integral coloring from alloy constituents
- Color behavior: Alloy-driven color variation gets amplified. The thicker oxide absorbs more light, and trapped alloying element particles create stronger color effects. Type III anodized 7075 comes out dark olive-brown to near-black, while 6061 lands medium gray to dark gray, with no dye applied at all.
Parameter Type II Anodizing Type III Hard Anodizing Typical thickness 5–25 µm (0.2–1.0 mil) 25–100 µm (1.0–4.0 mil) Dimensional growth (per surface) ~50% of total thickness ~50% of total thickness Hardness (Vickers) 200–400 HV 400–700 HV Wear resistance (Taber abrasion, mg/1000 cycles) 15–30 1.5–6.0 Dielectric breakdown voltage 400–600 V 800–1500 V Dye absorption capacity High Low to moderate Alloy color sensitivity Moderate High Typical color without dye (6061) Clear/silver Medium gray Typical color without dye (7075) Slight yellow-gray Dark olive-brown
What this means in practice
If you need both Type III hardness and color consistency across multiple alloys, the process window narrows considerably. At JLYPT, we handle this by running alloy-specific bath parameters, adjusting current density, temperature, and ramp profiles to shrink the visual gap between alloys in the same assembly.
Real-World Case Studies
Case Study 1: Aerospace Flight Control Bracket Assembly (Mixed 7075/6061)
Client
A Tier 2 aerospace supplier producing flight control actuator brackets for a commercial aircraft program. Problem:
The assembly had 14 components: 8 machined from 7075-T73 for structural strength and 6 from 6061-T6 for lower-stress mounting interfaces. All parts were specified as “black anodize per MIL-A-8625, Type II, Class 2.” The customer’s IPC inspector rejected three consecutive lots because the 7075 brackets showed a visible bronze undertone (measured ΔE = 4.8 against the 6061 reference standard). Root cause analysis:
- 7075-T73 contains 1.2–2.0% Cu and 5.1–6.1% Zn
- Copper-rich intermetallic particles (Al₂CuMg, Al₇Cu₂Fe) disrupted oxide pore uniformity
- Zinc added gray-brown coloring within the oxide film
- Standard black organic dye couldn’t overcome the substrate-driven color shift
JLYPT solution
- Alloy-segregated processing: 7075 and 6061 parts were anodized in separate batches with parameters optimized for each alloy
- Modified dye protocol for 7075: Extended dye immersion from 15 minutes to 22 minutes at 140°F; switched from single-dye to a dual-dye system (blue-black base coat + carbon black top coat) to neutralize the warm undertone
- Adjusted pre-treatment: Added a desmutting step with nitric acid/ferric sulfate solution formulated for high-copper alloys, removing copper-enriched surface smut that feeds color shift
- Color verification: Spectrophotometric measurement per ASTM D2244 confirmed ΔE below 2.0 between 7075 and 6061 parts in the final assembly
Result
The client passed incoming inspection on the next lot and has held a zero-rejection record over 18 months of production. Total annual volume: 2,400 bracket sets.
Working through color matching across mixed alloys? Talk to our engineering team about your assembly. We do alloy-specific process optimization and ΔE verification on every production lot.
Case Study 2: Medical Surgical Instrument Handles (6061 vs. 6063 Lot Variation)
Client
A medical device OEM producing reusable laparoscopic instrument handles for hospital sterilization environments. Problem:
The instrument handles were machined from 6061-T6 bar stock and Type II anodized in “blue” for product line identification. Over six months, the client saw progressive color drift: early production lots were a bright cobalt blue, while later lots shifted toward greenish-blue. ΔE between the first and most recent lot measured 3.2. Root cause analysis:
- The material supplier had substituted 6063-T6 bar stock for three production runs due to 6061 supply shortages
- 6063 contains less silicon (0.20–0.60% vs. 0.40–0.80%) and less copper (≤0.10% vs. ≤0.15–0.40%) than 6061
- The cleaner oxide on 6063 absorbed blue dye more efficiently, giving a brighter, more saturated blue
- When the supplier reverted to 6061, the color shifted back, but a third material lot from a different 6061 mill showed yet another shade due to composition variation within the 6061 specification range
JLYPT solution
- Material certification control: Implemented incoming material inspection with OES (Optical Emission Spectrometry) verification of Cu and Si content for every bar stock lot
- Dye concentration adjustment: Built a dye concentration correction chart indexed to measured Cu content: +5% dye concentration for Cu above 0.20%, −3% for Cu below 0.10%
- Color master standard: Created a physical color master panel from a characterized 6061 lot; all production batches get compared against this master using spectrophotometer readings
- Material specification tightening: Worked with the client to add a supplementary material requirement: Cu content 0.15–0.28%, Si content 0.45–0.65%, narrowing the allowable range within the 6061 specification
Result
Color variation across 12 consecutive production lots held to ΔE below 1.2. The client’s quality team approved JLYPT for direct-ship to hospital distribution centers without incoming color inspection.
Case Study 3: Automotive Suspension Upright (7075-T6 Hard Anodized)
Client
A motorsport engineering company producing aluminum suspension uprights (knuckles) for a Formula racing series. Problem:
The uprights were machined from 7075-T651 plate and specified with Type III hard anodize (2.0 mil / 50 µm thickness) for wear resistance at bearing interfaces. No cosmetic color requirement existed, but the team principal demanded visual uniformity across left-hand and right-hand uprights for brand presentation during televised pit stops. Parts from different forging lots showed color variation ranging from dark olive to charcoal gray (ΔE = 5.5). Root cause analysis:
- 7075 plate from different mills showed zinc content ranging from 5.1% to 6.1% and copper from 1.2% to 2.0%, all within AMS 4078 specification, but the spread was enough to produce visible color differences in Type III oxide
- The T651 temper involves stress-relieving by stretching, which can create directional grain structure differences between plate lots, another contributor to anodizing appearance variation
- Type III hard anodize at 50 µm thickness amplified every compositional difference because the thick oxide acts as an optical filter
JLYPT solution
- Single-lot material procurement: Sourced enough 7075-T651 plate from a single mill heat lot to cover the full season’s production (48 upright sets)
- Grain direction control: Oriented all CNC machining programs so the primary visible surfaces were cut parallel to the rolling direction, keeping grain-related optical effects consistent
- Type III process parameter lock: Fixed current density at 24 ASF (amps per square foot), bath temperature at 30°F (−1°C), and ramp rate at 2 ASF/minute to eliminate process-side variables
- Post-anodize color sorting: Measured L*a*b* values on every part; matched left-hand and right-hand pairs within ΔE below 1.5
Result
All 48 upright sets delivered with matched left/right color pairs. The team reported zero cosmetic concerns across the full racing season. Wear performance at bearing bores exceeded 15,000 km without measurable oxide degradation, confirming that the color-matching process adjustments didn’t compromise the functional performance of the Type III coating.
Racing a deadline with hard-anodized parts? Get a quote from JLYPT. We deliver Type III anodized CNC parts with full dimensional and color verification, typically within 10–15 business days.
Alloy Selection Guide for Color-Critical Anodized Assemblies
If your product needs consistent anodizing color across multiple components, alloy selection is the single most effective control lever. Process optimization can narrow the gap, but it can’t repeal physics.
Recommended Alloys for Decorative Anodizing (Color Consistency Priority)
Priority Alloy Why 1st choice 6063-T6 Lowest Cu and Si in the 6xxx series; cleanest oxide; architectural anodizing standard 2nd choice 5052-H32 No Cu; low Si; excellent oxide clarity; good for sheet metal parts 3rd choice 6061-T6 Industry workhorse; slightly more Cu and Si than 6063; good but not perfect color consistency 4th choice 5083-H116 Higher Mg content; slightly matte finish; good for marine/industrial applications Use with caution 7075-T6 High strength but poor color consistency; Cu and Zn cause significant color shift Avoid for color work 2024-T3 High Cu content makes consistent coloring extremely difficult Avoid for color work A356/A380 Cast High Si creates gray, matte, uneven oxide
When You Can’t Change the Alloy
Sometimes the alloy is dictated by structural requirements: 7075 for fatigue life, 2024 for damage tolerance, A356 for complex cast geometry. In those situations, these strategies reduce color variation: Pre-treatment optimization:
- Alkaline etch time adjustment (shorter etch for high-Cu alloys to limit copper smut formation)
- Specialized desmutting chemistry (nitric-ferric or nitric-HF solutions for 2xxx/7xxx alloys)
- Bright dip (phosphoric-nitric acid) for high-Si cast alloys to improve surface reflectivity before anodizing
Anodizing parameter adjustment
- Lower current density for high-Cu alloys (reduces oxide disorder caused by rapid Cu dissolution)
- Tighter temperature control (±0.5°F vs. standard ±2°F) for Type III on 7xxx alloys
- Voltage ramp profiling to manage heat generation around intermetallic particles
Dye system modification
- Multi-step dyeing (base coat + corrective top coat) to neutralize alloy-driven undertones
- Electrolytic coloring (tin or cobalt salt deposition) instead of organic dyes, which gives more alloy-independent color
- Inorganic dye systems (ferric ammonium oxalate for gold/bronze tones) that are less sensitive to pore structure variation
Post-treatment
- Mid-temperature sealing (nickel fluoride at 75–85°C) instead of boiling water seal, which produces a slightly different optical finish that can mask minor color differences
- PTFE-impregnated sealing for functional parts where color is secondary to lubricity
Dimensional Tolerance Considerations When Managing Color Across Alloys
Color management and dimensional control are linked. The anodic oxide layer grows both outward from and inward into the original metal surface. About 50% of the total oxide thickness adds to the part dimension, while 50% penetrates into the substrate.
Dimensional Growth by Anodizing Type
Anodizing Type Total Oxide Thickness Dimensional Growth Per Surface Growth on Diameter (OD) Growth on Bore (ID) Type II (thin) 0.0002″–0.0004″ (5–10 µm) 0.0001″–0.0002″ +0.0002″–0.0004″ −0.0002″–0.0004″ Type II (standard) 0.0004″–0.001″ (10–25 µm) 0.0002″–0.0005″ +0.0004″–0.001″ −0.0004″–0.001″ Type III 0.001″–0.003″ (25–75 µm) 0.0005″–0.0015″ +0.001″–0.003″ −0.001″–0.003″ Type III (heavy) 0.003″–0.004″ (75–100 µm) 0.0015″–0.002″ +0.003″–0.004″ −0.003″–0.004″
One thing to watch
The 50/50 growth ratio is an approximation. High-copper alloys (2024, 7075) tend toward a 55/45 or 60/40 outward/inward ratio because copper-rich intermetallic particles partially block inward oxide penetration. That means 7075 parts may show slightly more dimensional growth than 6061 parts at the same oxide thickness spec. When you’re managing color across alloys, you may need different oxide thicknesses on different alloys to hit visual uniformity, say a slightly thicker oxide on 6061 to darken it toward the naturally darker 7075 tone. That thickness difference has to be accounted for in the CNC machining tolerances. At JLYPT, our CNC programming team adjusts pre-anodize machining dimensions alloy-by-alloy when the anodizing spec includes both dimensional and color requirements. Treating machining and finishing as one engineered system is what prevents the common failure mode where color gets corrected but tolerances are blown, or vice versa.
Need CNC machining with integrated anodizing tolerance planning? Get a free DFM review from JLYPT. Our engineers evaluate your drawings for both dimensional and color feasibility before production begins.
Inspection and Quality Control for Anodizing Color Consistency
Color Measurement Methods
Method Equipment Metric Accuracy Cost Best For Visual comparison Color master panels, light booth (D65) Pass/fail subjective Operator-dependent Low Quick screening Spectrophotometer Portable or benchtop spectrophotometer L*a*b*, ΔE ±0.05 ΔE Medium Production lot verification Gloss meter 60° gloss meter Gloss Units (GU) ±0.5 GU Medium Gloss consistency check Colorimeter Tristimulus colorimeter ΔE (less precise than spectrophotometer) ±0.2 ΔE Low–Medium Field inspection
Recommended Specification Language for Drawings
A lot of color-related rejections come from vague drawing callouts. Instead of specifying “black anodize,” consider a structure like this: Weak specification (invites disputes):
FINISH: ANODIZE PER MIL-A-8625, TYPE II, CLASS 2
COLOR: BLACK PER [COMPANY] COLOR MASTER STANDARD CMS-2024-BLK-01
COLOR TOLERANCE: ΔE ≤ 2.0 PER ASTM D2244 (D65/10°)
GLOSS: 30–50 GU AT 60° PER ASTM D523
THICKNESS: 0.0004"–0.0008" (10–20 µm)
ALLOY RESTRICTION: ALL ANODIZED PARTS IN THIS ASSEMBLY SHALL BE
MACHINED FROM THE SAME ALLOY AND TEMPER DESIGNATION
That level of specificity kills ambiguity and gives your anodizer, and your incoming inspection team, objective acceptance criteria.
Common Myths About Anodizing Color Variation
Myth 1: “A good anodizer can make any alloy look the same.”
Reality
No amount of process skill overrides the physics of oxide growth on fundamentally different substrates. A skilled anodizer can shrink the gap. JLYPT routinely hits ΔE below 2.0 between 6061 and 7075 through alloy-specific processing. But expecting identical color between 2024 and 6063 isn’t realistic.
Myth 2: “Thicker anodizing hides color differences.”
Reality
The opposite is true. Thicker oxide amplifies alloy-driven color effects because more alloying element particles get incorporated into the oxide film. That’s why Type III hard anodizing shows greater alloy-to-alloy color variation than Type II.
Myth 3: “Powder coat over anodize solves the color problem.”
Reality
Powder coating over anodized surfaces is technically possible but adds cost, thickness, and process complexity. It also cancels out several benefits of anodizing (thin profile, metallic appearance, integral surface hardness). If color uniformity across mixed alloys is the primary goal and you don’t need the metallic appearance, powder coating directly on bare aluminum, skipping anodizing, is usually the more practical move.
Myth 4: “All 6061 is the same.”
Reality
The 6061 specification (AMS 4027 / ASTM B209) allows ranges for every alloying element. Copper can range from 0.15% to 0.40%, a 2.7× spread. Silicon can range from 0.40% to 0.80%. Parts machined from 6061 at the high end of the Cu range will anodize noticeably differently from parts at the low end. Mill-to-mill and heat-lot-to-heat-lot variation within the same alloy specification is a real and common source of color inconsistency.
How JLYPT Approaches Anodizing Color Control
At JLYPT, anodizing color management is built into the production workflow from quoting through final inspection. Here’s how we handle color-critical projects: 1. Material procurement control
- OES (Optical Emission Spectrometry) verification of incoming bar stock and plate
- Single-heat-lot procurement for color-critical production runs
- Tightened internal composition limits within the alloy specification range
2. CNC machining integration
- Alloy-specific pre-anodize dimensions calculated to account for oxide growth differences
- Surface finish control (Ra 0.8–1.6 µm) for consistent dye absorption, since rougher surfaces absorb more dye and appear darker
- Grain direction documentation for parts where rolling direction affects anodizing appearance
3. Pre-treatment customization
- Alloy-specific etch and desmut chemistry
- Process time and temperature adjustments based on incoming material composition data
- Dedicated rinse tanks to prevent cross-contamination between alloy families
4. Anodizing process control
- Alloy-segregated racking: 2xxx/7xxx parts are never co-processed with 5xxx/6xxx parts
- Current density, voltage, and temperature profiles optimized per alloy
- Real-time bath chemistry monitoring (free acid, dissolved aluminum, chloride contamination)
5. Dye and seal optimization
- Dye concentration and immersion time adjusted per alloy and per lot
- Multi-step dyeing available for challenging alloy combinations
- Seal quality verification per MIL-A-8625 (seal quality test per ASTM B136 or ASTM B680)
6. Final inspection
- Spectrophotometric color measurement on every lot (minimum 3 parts per lot, or 10%, whichever is greater)
- ΔE reporting against customer-approved color master standard
- Full dimensional inspection post-anodize to verify tolerance compliance
Running CNC machining and anodizing under one roof is where most of the value comes from. When machining and finishing are managed together, the feedback loop between dimensional control and surface finish quality is immediate, not separated by shipping time, communication delays, and finger-pointing between vendors.
Ready to work through your anodizing color challenges? Send your drawings to JLYPT for a free engineering review. We’ll flag potential color variation risks, recommend alloy and process solutions, and get you a detailed quote, typically within 24 hours.
Frequently Asked Questions
Can I get exact Pantone color matching with anodizing?
Not precisely. Anodizing is a translucent process, so the substrate always influences the final color. Organic dyes can approximate Pantone references, but exact Pantone matching (ΔE below 1.0 to a Pantone chip) is achievable only on select alloys (6063, 5052, 1100) with tight process control. On high-Cu or high-Si alloys, expect ΔE 2.0–5.0 from the Pantone target.
Does temper condition affect anodizing color?
Yes. Different temper conditions (T4 vs. T6 vs. T73) change the size, distribution, and composition of precipitate phases within the alloy. T6 temper (peak aged) in 7075 produces finer, more uniformly distributed MgZn₂ precipitates than T73 (overaged), which shows up as slightly different oxide optical properties. The effect is smaller than the alloy composition effect but measurable, typically ΔE 0.5–1.5 between tempers of the same alloy.
What is the most anodize-friendly aluminum alloy for CNC machining?
6063-T6 offers the best combination of machinability, anodizing response, and color consistency. Its mechanical properties (yield strength ~214 MPa / 31 ksi) are lower than 6061-T6 (276 MPa / 40 ksi) and significantly lower than 7075-T6 (503 MPa / 73 ksi). If structural requirements allow, 6063 is the optimal choice for color-critical anodized parts.
How does surface finish (machining marks) affect anodizing color?
Surface roughness directly affects perceived color. A polished surface (Ra below 0.4 µm) reflects more light through the oxide and produces a brighter, more saturated color. A machined surface with visible tool marks (Ra 1.6–3.2 µm) scatters light and appears darker and more matte. For color consistency, all parts in an assembly should carry the same surface finish specification on visible surfaces.
Can you anodize mixed alloys on the same rack?
Technically yes, but we recommend against it for color-critical work. Different alloys have different optimal current densities and dissolution rates. Co-racking 6061 and 7075 means one alloy is always running at a suboptimal condition, which widens the color gap. At JLYPT, we alloy-segregate all color-critical work.
What to Take Away
A few things to hold onto, whether you’re on the engineering or the procurement side:
- Anodizing color is substrate-dependent. The alloy composition beneath the oxide controls the final appearance more than any process variable.
- Copper and silicon are the primary color disruptors. Alloys with Cu above 0.5% (2024, 7075) or Si above 1% (cast alloys) will always deviate from the clean, neutral tones you get on 5xxx and 6xxx alloys.
- Same alloy equals best color match. If your assembly requires ΔE below 2.0 across components, specify the same alloy and temper for all anodized parts. Tighten the composition range within the alloy specification if lot-to-lot consistency is critical.
- Type III amplifies color variation. Hard anodizing produces thicker, denser oxide that magnifies alloy-driven color effects. Plan accordingly.
- Specification clarity prevents disputes. Use ΔE tolerances, reference color master standards, and specify alloy restrictions on your drawings.
- Keep machining and finishing together. Working with a CNC + anodizing partner ensures machining dimensions, surface finish, and anodizing parameters get co-optimized, which closes the gaps that cause color and dimensional failures when machining and finishing are split between vendors.
Anodizing color variation isn’t a defect. It’s a predictable consequence of aluminum metallurgy. With the right alloy selection, process engineering, and quality controls, consistent color across production lots and across alloy families is achievable. The key is addressing it at the design and sourcing stage, not after parts are already in the anodizing tank.
From alloy selection consulting to production-scale CNC machining and anodizing, we deliver color-consistent, dimensionally accurate parts, on time and to specification. Start your project with JLYPT today.